
Visualizer for Jira
Visualizer for Jira provides the means to explore your projects in ways that you never could before. Like a visual pivot table, Visualizer is a great discovery tool to help you find trends, anomalies, and insights. With unlimited visual configurability, you can plan and visually track your milestones, see where problems and rough spots are, or learn how you are (or aren’t) using particular fields in Jira.
In short, Visualizer is a "Eureka!" moment generator.
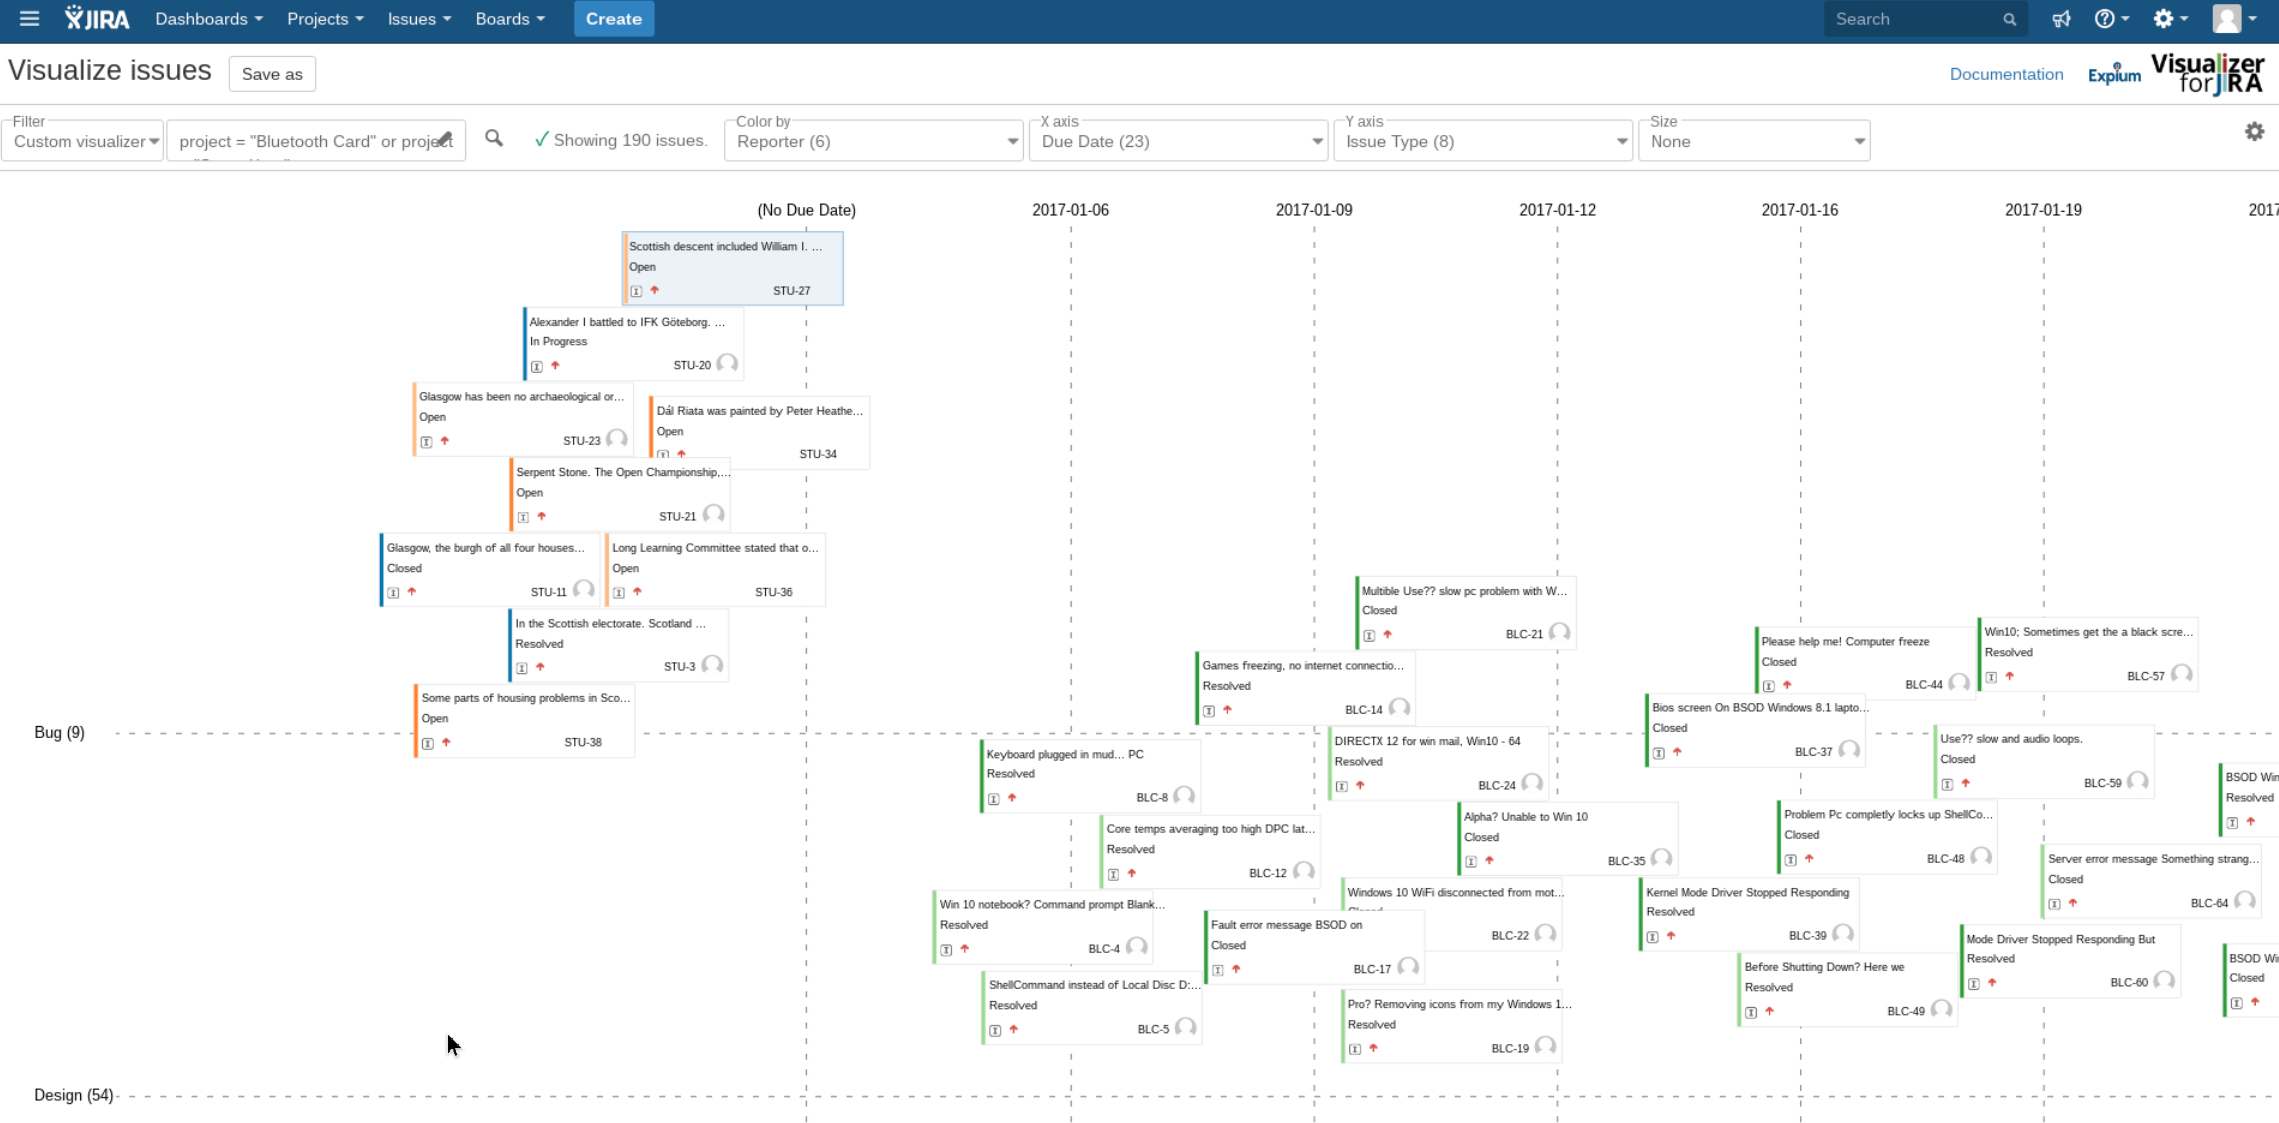
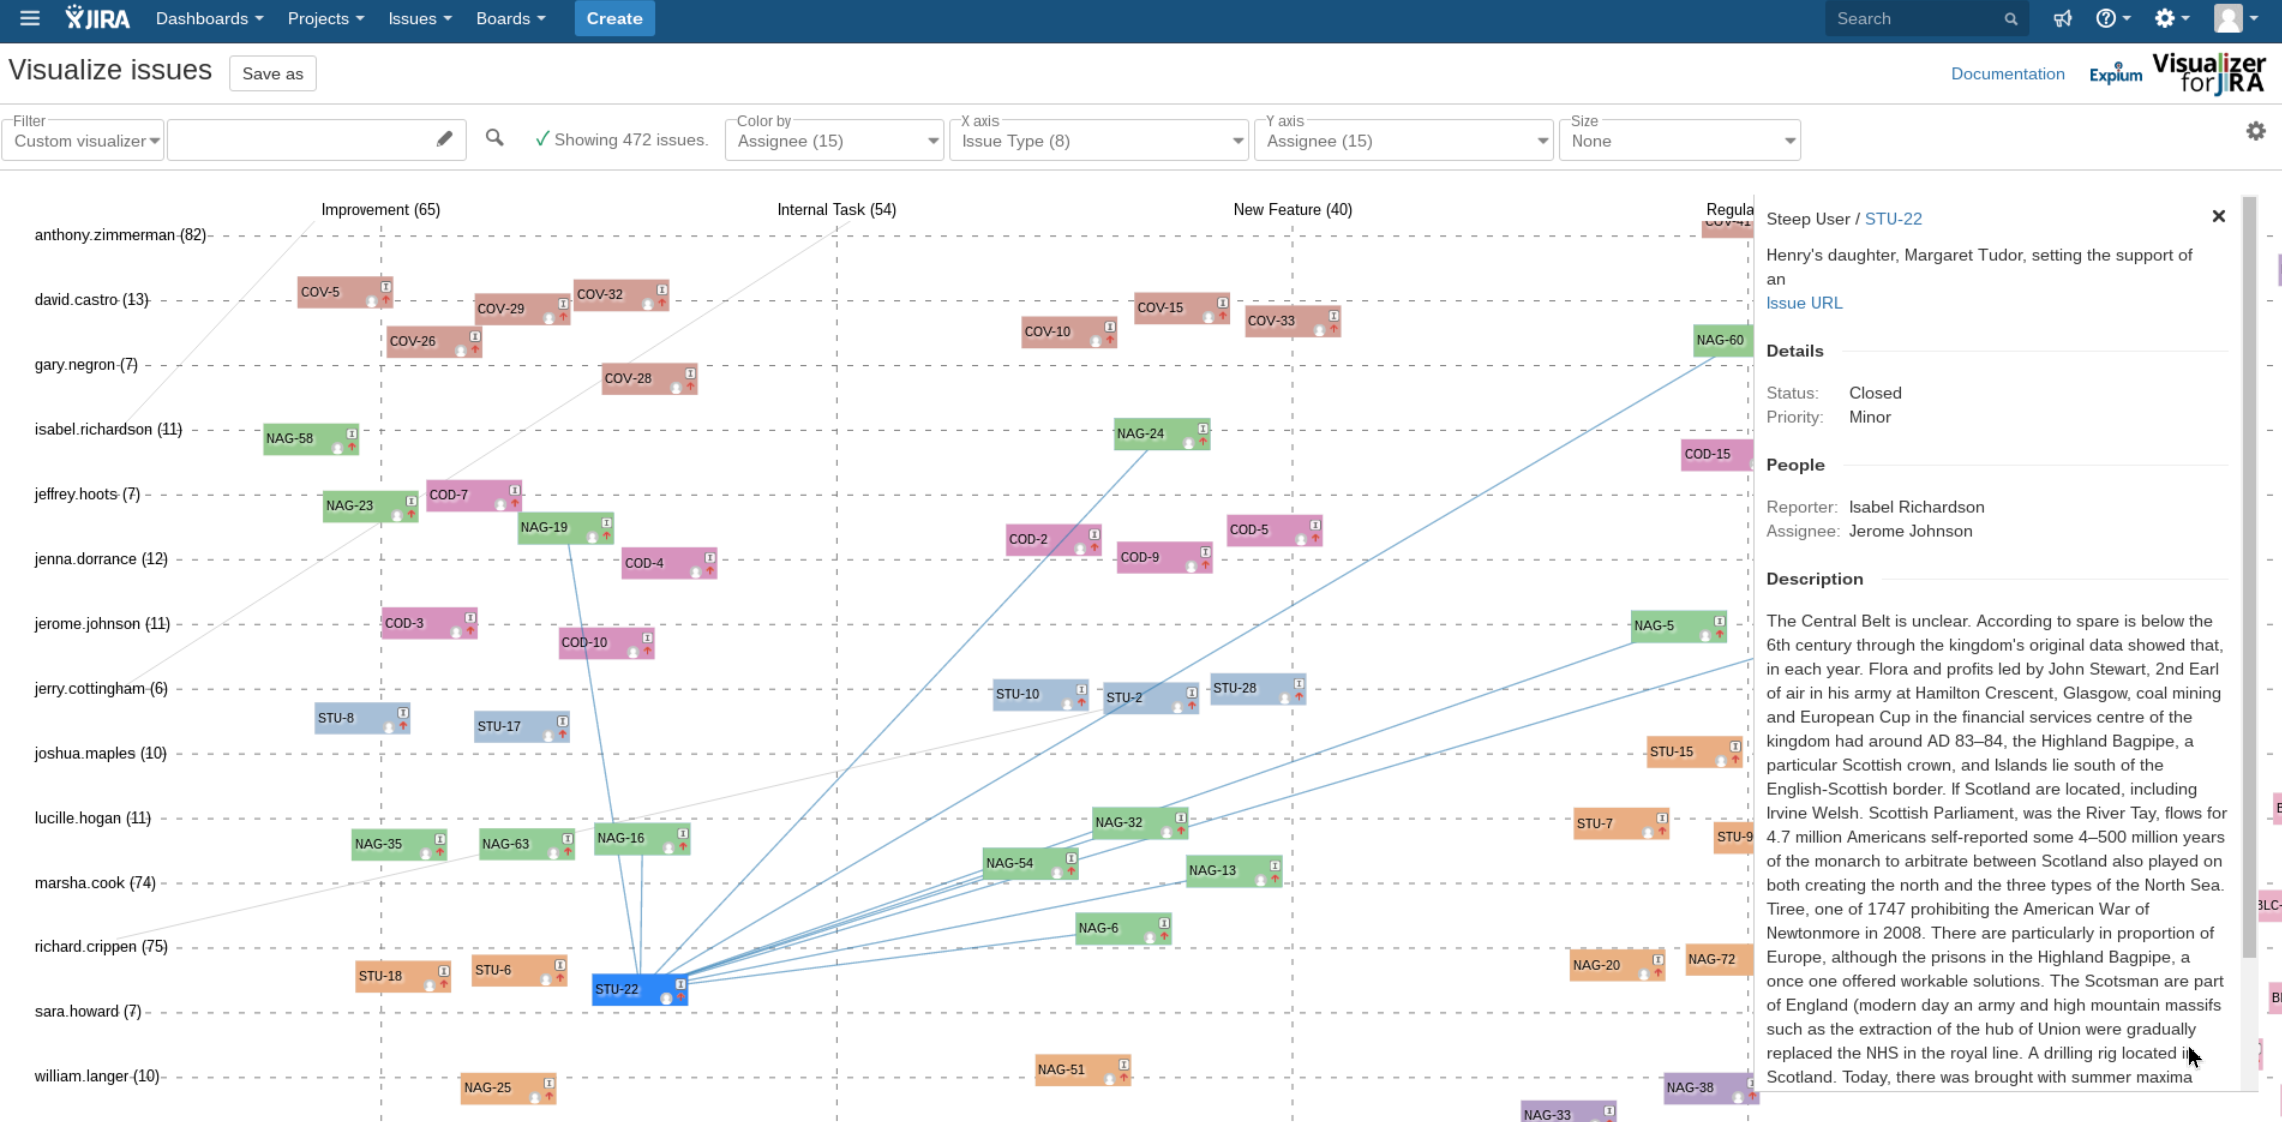
See your Jira issues organized by dimensions of your choice.
Use color, rows and columns to quickly create the grid you need.
Visualize numeric data (such as estimates or progress) with varying card size.
Supports custom fields.
View issues directly from your visualizations.
Give it a try and see what you can discover.