
Suggested visualizations
Visualizer lets you freely explore your data. For some new perspectives, try selecting the following X-Y fields while using the default configuration (click reset in the Configuration before beginning).
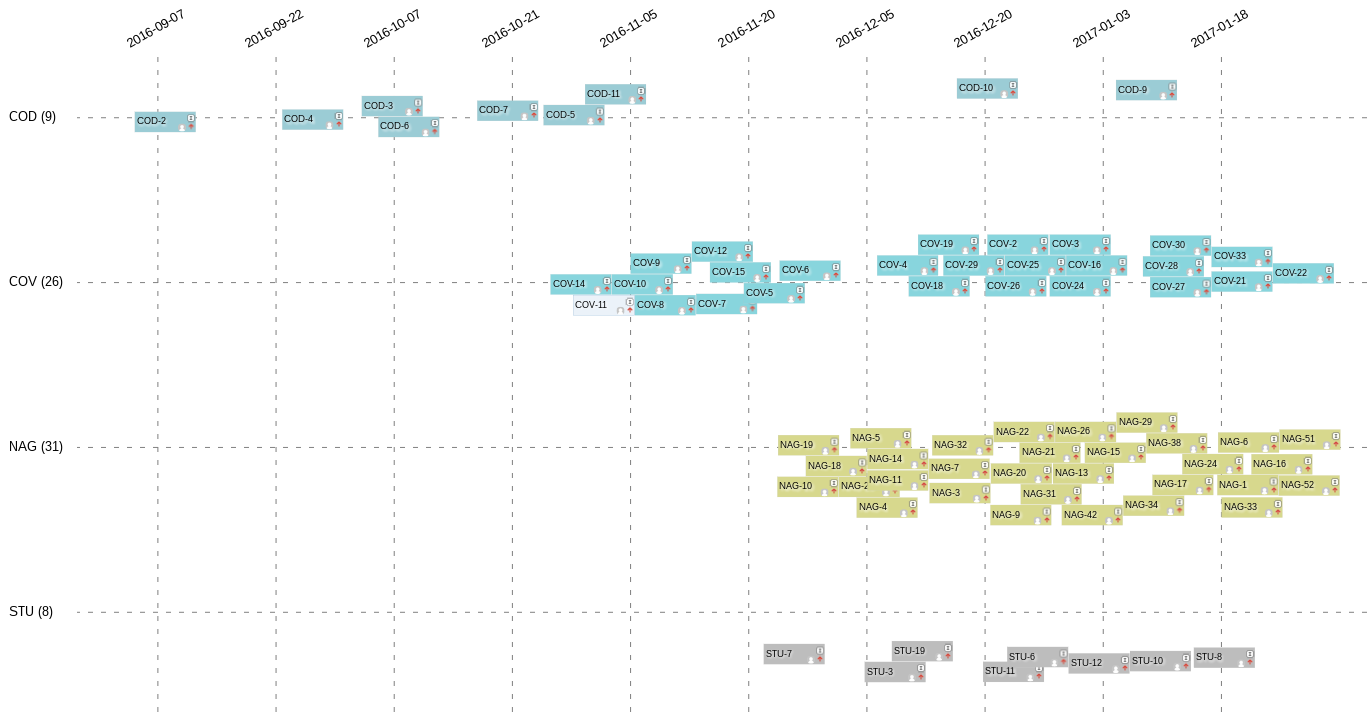
Resolved Date by Project
Visualize how the collective efforts of the company are distributed across projects or initiatives. See if resources are being allocated as intended.

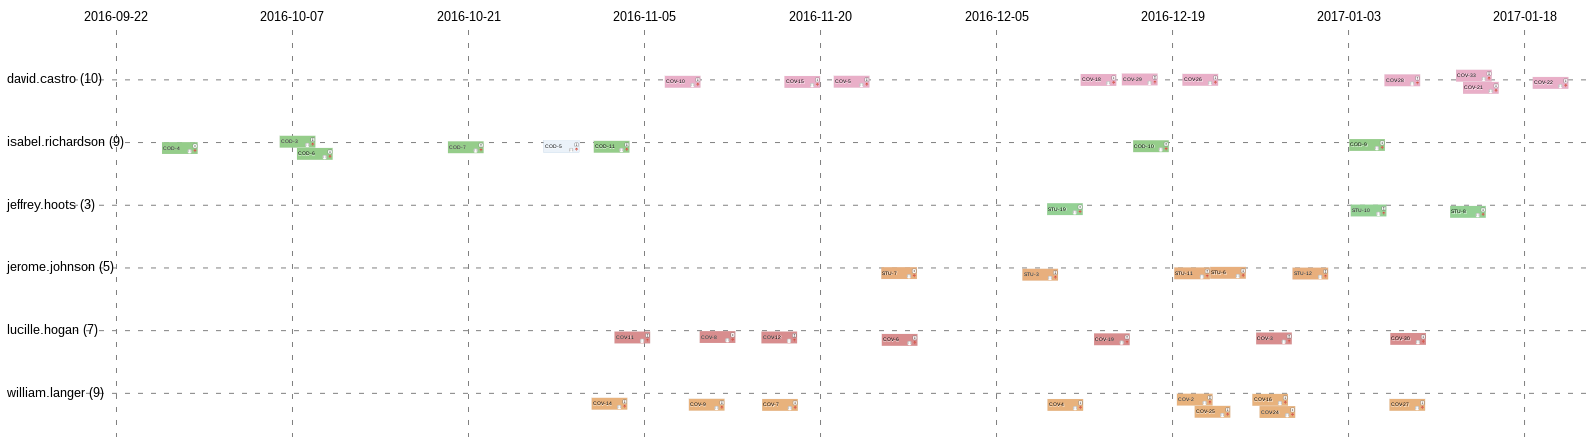
Resolved Date by Assignee
Visualize employee throughput over time and help discover inefficiencies in team dynamics, increases/decreases in performance over time per person, etc. Coloring by project can show you how an employee manages their time across multiple projects.

Resolved Date by Sprint
Inform your retrospectives by visualizing your sprints, bringing to light velocity, acceleration, and divergence from your estimates. Also discern how urgent items and other work are impacting the effectiveness of your planning.
Issue Status by Sprint
Visualize your issues à la kanban board to see your Work in Progress and ensure you aren’t overcommitted in any one area.
Dual-window visualizations
You can also set up two visualizations in adjacent windows, the left query looking at past events, the right looking at future events, and the same Y axis for both. Good choices for the Y axis include Projects, Assignees, etc. This visualization will show whether future planning is aligning with past performance.